Visitor flow – UX meets art
At D-LABS we specialize on supporting our customers in the user-centered conception, implementation and validation of digital products and services in the spirit of Design Thinking. However, consumer needs do not only play an essential role in the development of apps and websites, but in almost all areas of human experience. Thus, we work holistically and examine also the environment of the users very closely.
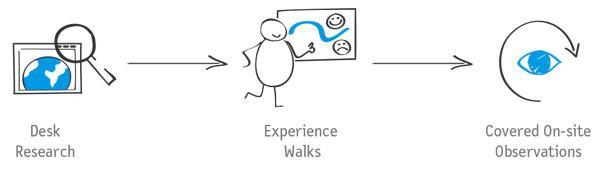
We were asked to investigate the user experience of visitors to an art museum. The operators found several bad reviews on the Internet and required clarification. The aim of the study was to identify both the positive and the negative aspects of the museum experience and to validate these aspects using qualitative research methods. In order to receive a comprehensive and objective assessment of the user experience, it makes sense to integrate many different perspectives from various sources of information into the analysis. Therefore, we used three different methods: desk research, experience walks, and visitor flow analysis through participant observations.
Methodological approach
Desk research and experience walks
Based on a desk research, we first got an overview of existing reviews on portals like Google or Yelp. The ratings were predominantly high. However, some criticism recurred, the perceived overcrowding of the museum being the largest cause of dissatisfaction.
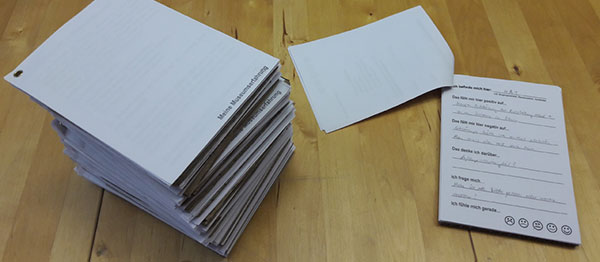
In a second step, we wanted to check whether the results from the desk research could be validated using another qualitative research method. We sent a number of people on an experience walk to the museum. For this purpose, we created small booklets and asked people to write their experiences down when buying the online ticket, during the museum visit and afterwards. The information we obtained this way contained descriptions of the visitors’ positive and negative experiences as well as their thoughts, questions and feelings regarding each situation. The experience walk booklets proved to be an effective way to get numerous field reports with little effort and in a short period of time.
The evaluation of the experience walk booklets initially showed that the visitor experience is not as bad as some of the reviews on the internet suggested. Indeed, the exhibition concept and the spatial layout of the museum offered here and there still room for improvement. However, the visitors’ experience was hardly diminished by that. On the other hand, the finding from the online reviews, that the flow of visitors is the weak spot of the museum, was confirmed. The distribution of visitors to the various floors and showrooms is not optimal. Thus, the museum quickly appears to be overcrowded, especially on weekends or during holiday season. Other criticisms, such as the stressed staff or the constant beeping of alarm systems, can also be traced back to the faltering flow of visitors.
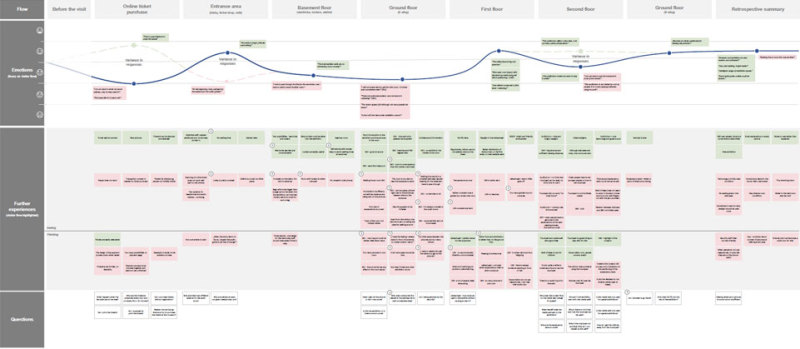
To integrate the numerous field reports from the experience walk booklets and the online portals, we decided to create a Visitor Experience Map. Based on the Customer Journey Map, it is a helpful tool to clearly visualize the complete user experience.
Experience walk booklets
Visitor flow analysis
Our previous findings indicate that the main reason for the visitors’ dissatisfaction lies in the poor distribution of visitors. Therefore, in a last step, we performed an in-depth visitor flow analysis. The goal of this analysis was to identify the museum’s hot and cold spots. Hot and cold spots were defined as waypoints along the exhibition tour, which are particularly busy and remarkably empty, respectively. Furthermore, it was necessary to discover the causes of these congestions. In order to do so, we positioned ourselves at various spots within the museum as part of a participant observation and monitored the stream of visitors at different times of the day.
Our observations showed that congestions often occur on the lower levels of the building, even if the museum as a whole is not very crowded. By contrast, the showrooms on the upper levels are poorly attended, although they could well be used to balance the distribution of the visitor flow. Different reasons account for why this is not happening. On the one hand, the museum’s structure suggests that the exhibition tour must be started in a certain room on the ground floor, even though, according to the concept of the museum, there is no fixed starting point and end point of the exhibition. Furthermore, the rooms, which are only scarcely filled, offer conspicuously little exhibits and information material compared to the museum’s hot spots and thus no incentive to stay there longer. All of this leads to a negative visitor experience right at the beginning of the exhibition that rubs off on the entire exhibition tour.
This museum project shows that UX research cannot only be of great use in the field of digital products and services, but also plays an important role in all kinds of experiences. Also worth mentioning is the selection and combination of qualitative methods, as it allowed us to identify very specific consumer needs and weak spots that can easily be overlooked when using a quantitative approach (e.g., a classic survey). Building on the combined results obtained from the different methodological approaches, solution strategies can now be developed that optimize the visitors’ trip to the museum and ensure a completely positive user experience. Even on a more crowded day.
Contact
14482 Potsdam
potsdam@d-labs.com
10245 Berlin
berlin@d-labs.com
70173 Stuttgart
stuttgart@d-labs.com